How to Analyze Your Own Sales Data to Discover Winning Products
Contents

Have you noticed that some products sell well while others don’t? We’ve been there, too. The key is to analyze winning products by examining sales data closely.
This helps you see what your customers want. By analyzing your sales data, you can find patterns and trends. You’ll know which items are popular and why.
For example, maybe a certain gadget sells more during holidays or a type of clothing gets great reviews consistently.
We’ll guide you through easy steps to analyze your sales data. You’ll learn to track important metrics like sales volume, revenue, and customer feedback. With these insights, you can choose the best products to stock, promote, and grow your dropshipping business.
Key Takeaways
- Start by collecting comprehensive data from all your sales channels to get a complete view of your store’s performance.
- Analyze sales volume and revenue to identify which products sell the most and contribute the most to your profits.
- Evaluate profit margins to ensure that your best-sellers are your most profitable products. Use tools like Sell The Trend’s Shopify Profit Calculator to simplify this process.
- Review customer feedback to understand what customers love, what needs improvement, and how to meet their expectations better.
- Spot trends and patterns in your sales data to plan inventory, promotions, and product launches based on real demand.
Why Analyze Sales Data?
You analyze your sales data to uncover what sells, why it sells, and how you can improve. When you look at the details behind each transaction, you see which products drive your profits and which ones might need a second look.
This knowledge keeps you from making blind decisions and wasting time or money on guesswork. Essentially it helps to:
- Identify high-performing products that deserve more attention or marketing.
- Spot underperformers before they drain your resources.
- Uncover trends that guide you to time your promotions, stock up on hot items, or pivot your strategy.
One of the biggest benefits of analyzing sales data is the chance to improve your customer experience. By seeing what people buy—and sometimes what they don’t—you can tailor your store offerings, pricing, and promotions to match real demand.
If a product sells well during a specific season, plan a timely campaign next year or consider expanding that product line. If another item rarely sells, investigate why. Maybe the price is too high, or the product description needs a refresh to highlight its real value.
The best part is that it doesn’t have to be hard. With simple tools, you can quickly measure your product’s performance.
For instance, our product research tool does the heavy lifting for you. It tracks sales, profit margins, and customer feedback in one place:

Looking at these metrics helps you make smart decisions. You’ll know what products to stock more of, which ones to promote in your marketing, and which ones to discontinue. This saves you money meets your customers’ needs, and grows your business.
Analyzing your sales data removes the guesswork from finding winning products. It gives you clear insights to build a successful dropshipping store.
How To Analyze Your Own Sales Data: 6 Key Steps
Ready to see which products actually drive profits and which ones just sit on the shelf? In this guide, we’ll walk you through 6 essential steps to analyze your own sales data.
Consider how each helps you gather accurate data, measure performance, and refine your products.
1. Collect Comprehensive Data
To truly understand your store’s performance, gather sales information from every channel, including your main website, social media shops, and marketplaces.
By viewing all these sources together, you’ll see a clear picture of how each product sells and where your traffic comes from.
Shopify Analytics

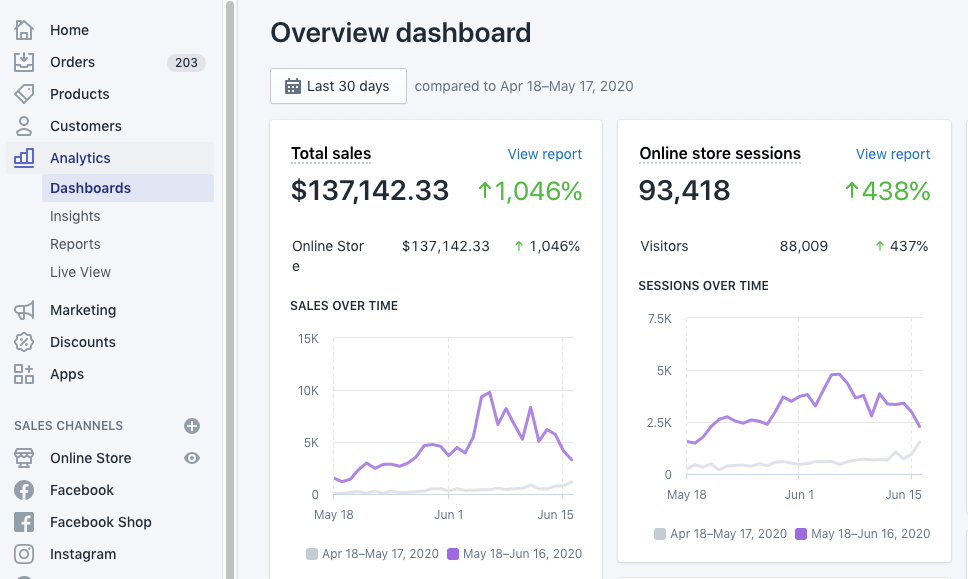
If you run your store on Shopify, take advantage of its built-in analytics. Shopify Analytics gives you real-time insights into sales, best-selling products, and customer behavior.
For example, you can track which pages get the most visitors or which items end up abandoned in carts. This data helps you spot trends fast and decide where to focus your efforts.
SellShop Analytics

If you’re selling on other platforms, your sales data might be scattered. SellShop Analytics pulls everything into one dashboard, so you know which channel is generating the most revenue and which products work best.
Instead of juggling spreadsheets, you get a single place to check how your store is doing across multiple outlets.
Collecting comprehensive data doesn’t have to be a chore. Set up a regular time—weekly or monthly—to check these tools. Look for big jumps or drops in sales, and try to pinpoint why they happened.
Maybe a social media post went viral, or a product got a sudden surge of positive reviews. Keeping your data organized and up to date gives you a solid foundation to make decisions that lead you to winning products and long-term growth.
2. Analyze Sales Volume And Revenue
Sales volume reveals how many units you sell for each product, while revenue shows how much money you earn from those sales. By monitoring both, you’ll see which items spark the most interest and how much they really contribute to your store’s success.
Start by looking at your day-to-day or week-to-week sales patterns. If you notice a sudden jump in sales for a particular product, dig deeper to figure out why.
It might be due to a seasonal trend, a recent promotion, or even an influencer mention. Understanding the cause helps you decide whether to double down on your marketing efforts or prepare more inventory.
- Track your top performers: Identify which products consistently bring in strong revenue.
- Spot underperformers: Notice any items that lag in sales or revenue, and figure out why.
- Compare sales volume to revenue: A product might sell a lot but still have low overall earnings if its price is too low or if costs are high.
Watch for patterns that occur over time. For instance, you might see increased sales for certain products during the holiday season or after a major social media campaign.
Recognize those trends so you can plan your next moves—like launching new ads or stocking up on a bestseller.
3. Evaluate Profit Margins
Profit margins show how much money you keep after covering all your costs. Even if your sales volume and revenue look amazing, thin margins can hurt your bottom line.
That’s why it’s crucial to break down each product’s expenses, including production, shipping, marketing, and platform fees. When you know exactly where your money goes, you can make better decisions to boost your profits.
Pro Tip: Use the Shopify Profit Calculator from Sell The Trend to see how changes in price or shipping costs affect your overall earnings. A small tweak in pricing or shipping fees can significantly change your profit margin, so experiment to find the sweet spot that balances sales and profitability.
- Track every expense that goes into selling each product.
- Compare margins across your entire product lineup to spot the real moneymakers.
- Test different pricing approaches to find the balance between sales volume and profit.
Keep in mind that a product can have high sales but still yield low returns if your costs are too high. For example, you might run ads that double your sales, yet if the ad spend eats up most of your profit, it may not be worth the effort.
In that case, refine your targeting or explore cheaper advertising methods to keep more money in your pocket.
If you find a product with a strong profit margin, think about ways to scale it up. Perhaps you can run a dedicated marketing campaign that highlights its best features or bundle it with other items to increase the average order value.
On the flip side, if you discover a product isn’t profitable despite decent sales, check if you can lower costs or if it’s better to focus on more lucrative items.
4. Review Customer Feedback
Customer feedback is like a direct line to what people think about your products. Even the best sales data can’t tell you exactly why someone loved an item or found it lacking.
By actively reviewing and responding to customer comments, you gain insights that can shape your marketing, improve your products, and build trust with your audience.
Start by collecting reviews from every platform you use. If you sell on Shopify, check your store’s review section.
If you have a presence on social media or other marketplaces, monitor comments and ratings there too. Don’t forget to look at email responses or direct messages from customers who prefer more private communication.
- Identify common themes: If multiple customers mention sizing issues, you know it’s a recurring problem.
- Spot trends in positive comments: People may praise a specific feature or design choice. Lean into these strengths when you market the product.
- Address negative reviews constructively: Acknowledge the problem and offer solutions or refunds. This shows you care and can often turn an unhappy customer into a loyal one.
When you notice patterns—like repeated complaints about slow shipping—take action immediately. You might need to switch logistics partners or set clearer delivery expectations on your website.
On the flip side, if you see that buyers rave about your product’s durability, highlight that in your ad campaigns or product descriptions.
Keep track of feedback over time. A handful of negative reviews might not mean the product is doomed, but if issues keep popping up, you’ll know it’s time to make a change.
Encourage honest reviews by sending follow-up emails or offering a small discount for customers who share their experiences. This helps you gather more data and boosts engagement.
5. Spot Trends And Patterns
Seeing patterns in your sales data gives you a crystal ball for planning future moves. It’s not just about random spikes or dips—there’s usually a reason behind every change in demand.
By spotting these trends early, you can react faster, make smarter inventory decisions, and even launch targeted marketing at just the right time.
Start by comparing your data from different periods. Look at sales week to week, month to month, or even year to year. If you see a steady rise in sales around certain holidays, that’s a clue to increase your stock and possibly run special promotions.
On the other hand, if you notice a drop during certain months, prepare by cutting back on inventory or experimenting with new product lines to keep revenue flowing.
- Watch for recurring spikes and dips that happen at the same time each year.
- Pay attention to which product categories tend to surge together.
- Note if your customers respond better to certain ads or email campaigns in specific seasons.
Trends don’t just revolve around the calendar. You might spot a new fad in your niche by looking at which products suddenly gain traction. For instance, if you notice that a previously slow-selling fitness gadget suddenly takes off, research why.
Maybe there’s a social media challenge boosting its popularity, or a health trend capturing everyone’s attention. To stay ahead of emerging trends, many successful sellers use automated data collection to monitor product performance across multiple marketplaces, track competitor pricing strategies, and identify trending items before they become saturated.
If you can replicate that success with related items, you’ll capitalize on the momentum.
A key benefit of spotting trends and patterns is that it removes the guesswork. Instead of randomly guessing which products to promote, you use actual data to guide your strategy.
Over time, you’ll see how certain products evolve with changing customer preferences, allowing you to adapt before your competitors do.
6. Make Data-Driven Decisions
Turning raw numbers into actionable strategies is where all your analysis pays off.
Once you’ve collected data, analyzed sales volume and revenue, checked profit margins, reviewed customer feedback, and spotted trends, it’s time to put these insights to work. Making data-driven decisions means basing your choices on facts rather than guesswork.
Often, you’ll spot products with strong sales but low margins. That could mean you need to adjust your pricing, find a cheaper supplier, or cut down on marketing expenses.
Conversely, if you see products with moderate sales but excellent profit margins, consider ways to scale those items. Maybe it’s time to increase your ad budget or feature them in a special promotion.
- Focus on your top-performing items and invest in scalable marketing channels.
- Drop or improve underperforming products rather than leaving them to drain resources.
- Test new product ideas quickly and let data guide whether they stay or go.
- Monitor changes over time to ensure your strategies keep up with market shifts.
Remember that data-driven decisions aren’t a one-and-done task. As market conditions, consumer preferences, and online store trends evolve, you need to revisit your metrics regularly.
Keep using tools that give you a clear view of how products perform, from the cost of goods to shipping fees. This ongoing process helps you fine-tune your approach and catch issues before they become major problems.
Another benefit of making decisions based on numbers is that it helps you avoid emotional biases.
It’s easy to hold onto a product you love, even if it’s not profitable. Having a data-backed strategy keeps your store agile and aligned with what the market wants.
Analyze Winning Products: FAQs
Here are some common questions about analyzing winning products that can guide you in deciding which items truly drive success in your store.
1. How To Know If It’s A Winning Product?
Look at market demand, check search volume on Google Trends, and study your sales performance. If it’s among the trending products in your niche and consistently attracts attention, there’s a good chance it’s a winner.
You can also use dropshipping product research tools or other research tools to confirm whether it meets your goals for profitable products.
2. How Do You Identify Good Products?
Start by brainstorming product ideas that solve real problems. Then, analyze market trends to see if there’s enough interest.
If your online store audience is responding well—measured by high sales or engagement—you’re on the right track. Keep an eye on factors like ease of shipping, low returns, and positive reviews.
3. How Do You Define A Winning Product?
A winning product meets clear market demand, stands out from competitors, and generates consistent sales performance.
It should be simple to market, have a decent profit margin, and fit seamlessly into your brand’s story. Tools like dropshipping product research tools can help you spot these opportunities early.
4. What Does A Succesful Product Look Like?
Successful products often show steady growth in Google trends, have enough search volume to signal strong interest, and deliver reliable profit margins.
They also rank as profitable products by maintaining healthy sales over time. When you see an item continually appearing on “best seller” lists or topping your revenue charts, you’ve likely found a winner.
Conclusion
Analyzing your own sales data is one of the most effective ways to find winning products for your dropshipping store.
By gathering accurate information, spotting trends, and listening to customer feedback, you’ll have a clear roadmap to improve your offerings and boost profits. Don’t rely on guesswork when real numbers can guide you toward success.
Remember, the goal is to keep testing, refining, and learning. As you discover high-performing products, double down on what works, and don’t be afraid to drop items that fail to meet expectations.
Staying flexible and data-focused will help you stay ahead of changing market demands.


